


During the late-2000s and the early 2010s, I found myself unsatisfied with the quality of most of the music that was being served to me through the radio. However, with the advent of streaming services, I started to explore country music again and found artists whose music I thoroughly enjoy.
In September of 2020, YouTuber Grady Smith released a video analyzing the lyrics of the top 471 most popular country songs from 2014-2019. As I watched his video, I wondered if there was any statistical difference between the lyrics of mainstream country artists and some of the lesser-known artists I enjoy. The burning question ultimately led me to use my programming skills to collect the lyrics of over 14,500 songs and build a website that allows me (and you) to analyze the data.
This is my approach to analyzing the lyrics and some of the interesting results I discovered along the way.
While there are many ways to analyze the lyrics of a song, I focused my analysis on answering three main questions: how stereotypical, how repetitive, and how unique are the lyrics? That main gripe about mainstream country music is that it all sounds the same… trucks, beer, tan legs, etc… But does it really?
The following sections explain how each rating was calculated, the overall results, and any interesting trends I noticed in the data. The final section will discuss women in country music and any statistical differences in the dataset between men and women.
In late September of last year, I collected a list of albums released from 2010 to 2020 from AllMusic.com. Any music released after September of 2020 is not included. Also, albums released slightly before this date are also not likely to have been included, especially by lesser-known artists. With each album, I associated an artist and a year. From this list of albums, I then programmatically associated each album with an album on Spotify. Next, I converted the list of albums into a list of songs and associated each with an artist, album, year, genre, and popularity. I then spent about a week perfecting a program to search for lyrics across multiple popular lyric websites and associated these with each song. In the end, I ended up with just over 14,500 songs in the dataset.
Before I continue with my findings, I need to define popularity because it has a precise meaning in this article.
The popularity of a song is a value between 0 and 100 calculated by Spotify, but how it is calculated is not information Spotify has released.
Here is what the Spotify developer page says about how they calculate popularity: “The popularity is calculated by algorithm and is based, in the most part, on the total number of plays the track has had and how recent those plays are. Generally speaking, songs that are being played a lot now will have a higher popularity than songs that were played a lot in the past.”
Whenever I used the term “popularity” going forward, I am specifically referring to the popularity calculated by Spotify.
In addition, I have created a website, countrylyricanalysis.com, that presents all the data I have collected in a digestible manner and allows the user to complete their own analysis of the data. The website contains all my findings discussed below as well as some more insights into the data.
Stereotypicalness
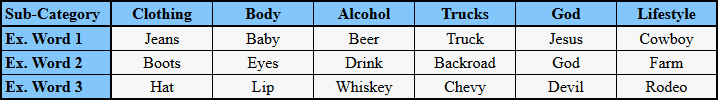
The stereotype rating associated with a song is an attempt to quantify the stereotypicalness of its lyrics. Simply put, it is the percentage of words in the song that are deemed stereotypical. The stereotype rating is separated into six distinct sub-categories: clothing, body, alcohol, trucks, god, and lifestyle.
To determine which words were stereotypical, I looked through all the words in the dataset that were used more than 50 times. If I believed a word to be stereotypical, I assigned it to a sub-category. Any variations of the word (plural, -ing, etc.) were also assigned to the sub-category. No word was assigned to more than one sub-category. Each stereotype sub-category is the percentage of words in the song assigned to that specific sub-category.
For example, in “Beer Never Broke My Heart” by Luke Combs, the song’s overall stereotype rating is 14.8%, which just means that for about every 20 words in the song, 3 fell into one of the stereotype sub-categories. For instance, 5% of the words used fell into the alcohol sub-category.
Above are some examples of words in each sub-category. It is important to note that the trucks category is not specific to trucks, but anything related to vehicles.
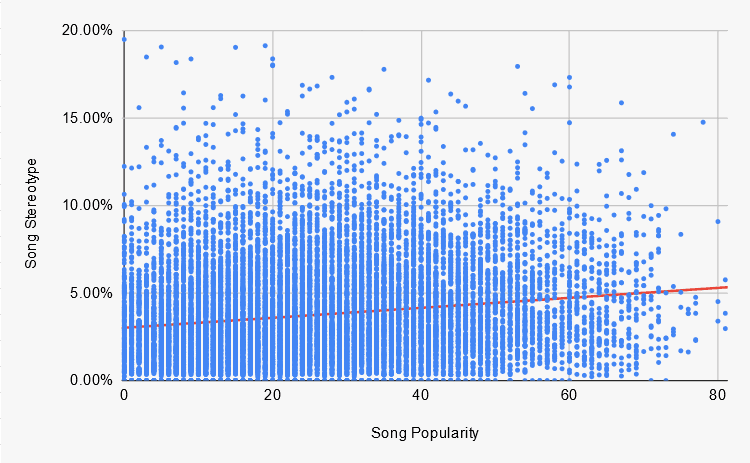
Above is a scatter plot, which shows the popularity versus the stereotypicalness where each dot represents a song. The red line is the trend line of the data, and its positive slope indicates that, in general, as popularity increases, so does the stereotypicalness of the words used.
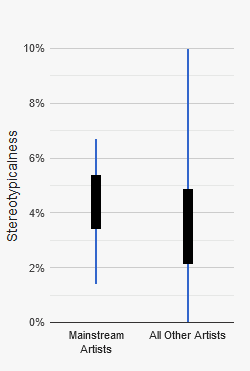
Now let’s look at the stereotypicalness of artists, specifically, the stereotypicalness of the top 50 most popular mainstream artists versus all other artists. Above, the candlestick graph’s blue lines show the overall stereotype range of mainstream artists and all other artists, respectively. The black box shows the standard deviation around the mean, or more simply, it shows the stereotype range where the majority of artists fall.
The average stereotypicalness for the entire dataset is 3.7%, and only 10 out of the 50 most popular mainstream artists are below this average in stereotypicalness.
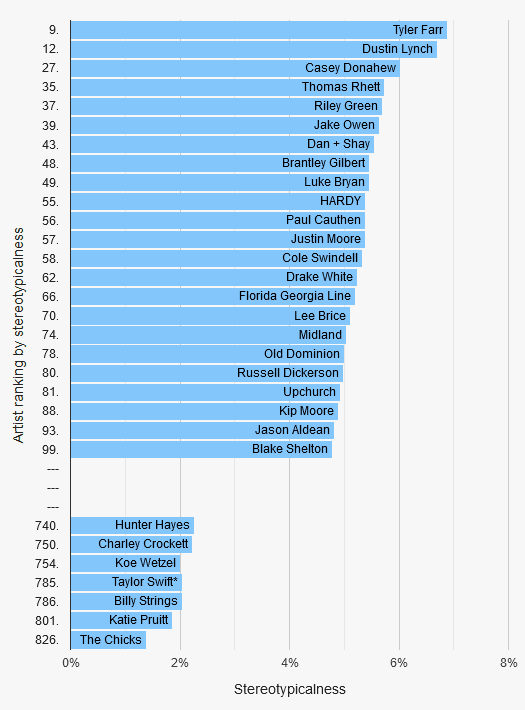
Above is a list of the top 100 and bottom 100 artists ranked by stereotypicalness. Only artists in the top 100 most popular are displayed. In total, 23 of the 100 most popular artists are among the most stereotypical, whereas only 7 of the 100 most popular artists are among the least stereotypical. Keep in mind that this dataset has a total of 836 artists.
*Only Taylor Swift’s music before her first pop album (1989) was included in the analysis.
Over the past decade, there has been a shift in mainstream country music away from the “Bro-Country” of the early 2010s to “Boyfriend Country.” With that change, there has been some change in the frequency of the stereotypes used. Over all songs, there has been a negligible change in the frequency of stereotypes. However, for the top 100 most popular songs, the average overall stereotype peaked at about 5.5% in 2011 and 2013 and has steadily decreased to around 4.5% in 2017-2020.
There have also been changes in the stereotype sub-categories’ frequency for the top 100 most popular songs. The average body stereotype decreased from around 2.5% in 2011 and 2013 to around 1.9% in 2017-2020. The average alcohol stereotype increased from around 0.5% in 2010-2012 to around 1% in 2018-2020. Finally, the average truck stereotype decreased from 1% in 2011 and 2012 to around 0.5% in 2017-2019. All other sub-categories (clothing, god, and lifestyle) stayed relatively consistent for the top 100 most popular songs.
Diversity
The diversity of a song is the number of unique words divided by the total number of words in the song.
Consider the line from “The Git Up” by Blanco Brown: “To the left, to the left now (to the left, to the left).” The line has 13 total words but only four distinct words (to, the, left, now). Therefore, this line has a diversity of around 0.31. The highest diversity possible is 1, while the lowest theoretical diversity is 0. The diversity of a song is closely related to the repetitiveness of the lyrics. Generally, the higher the diversity, the lower the repetitiveness, and vice versa. However, I made a conscious decision not to call this metric repetitiveness because it cannot determine the repetitiveness of the phrases used in a song, just the words.
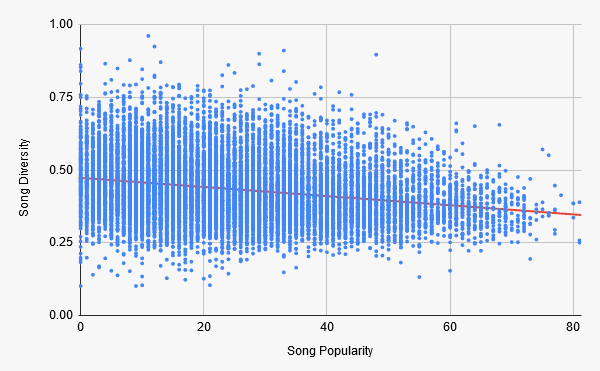
Above is a scatter plot above of the popularity versus diversity. In this graph, each dot represents a song. The trend line’s downward slope indicates that more popular songs are less diverse (more repetitive).
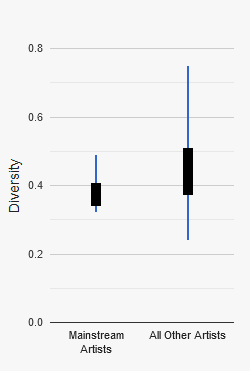
Now let’s look at the diversity of artists, specifically, the diversity of the top 50 most popular mainstream artists versus all other artists. The candlestick graph above shows the overall diversity range (in blue) and the diversity range where the majority of artists fall (in black). The most popular mainstream artists are much less diverse than all other artists.
Notice how even the most diverse mainstream artist (top end of the blue bar) does not surpass the most common range (black box) for all other artists. The average diversity in the dataset is 0.43, and only 5 out of the top 50 mainstream artists have a diversity rating higher than average. The data clearly shows that mainstream artists are significantly less diverse than all other artists.
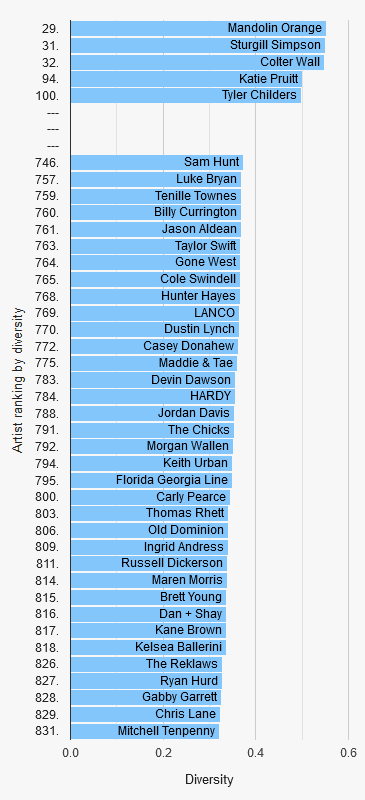
Above is a list of the top 100 and bottom 100 artists ranked by diversity. Only artists in the top 100 most popular are displayed. Overall, 5 of the 100 most popular artists are among the most diverse, whereas 35 of the 100 most popular artists are among the least diverse (most repetitive). It is also important to note another difference between the most diverse and least diverse artists. The most diverse artists listed above are much more associated with Independent country, while the least diverse artists have a much stronger relationship with Nashville and country radio.
Finally, it is worth noting that there has been no statistically significant change in diversity over the past decade.
Uniqueness
The uniqueness of a song is determined by the commonness of the words used in the song’s lyrics.
Similar to diversity, the highest possible uniqueness is 1, while the lowest theoretical uniqueness is 0. However, unlike diversity, this compares the words used in a song’s lyrics to all other words in the dataset. The more frequently a word is used, the less unique it is and vice versa. I think this is better understood with an example. Let’s revisit that same line from “The Git Up” by Blanco Brown: “To the left, to the left now (to the left, to the left).” The line has a uniqueness of around 0.05. Now let’s look at a line from “Confused” by Jason Hawk Harris: “Learning Greek between our sheets. Evolution, Holy Ghosts, and entropy”. The line has a uniqueness of around 0.87.
Now, how uniqueness is calculated is somewhat complex. First, words like “the,” “a,” and “and” are ignored as well as all articles, coordinating conjunctions, pronouns, demonstratives, and qualifiers. Next, my program counts the number of total uses for each word. Words are then assigned a rank, with the most used word receiving a rank of 1. The second most used word receives a rank of 2 and so on. Words with the same number of uses receive the same rank. Each word is then assigned its own uniqueness rating, calculated by taking the word’s rank divided by the highest numerical rank. So, words that are only used once in the entire dataset have a rating of 1 (highest numerical rank / highest numerical rank). The word used the most in the entire dataset has the uniqueness ranking closest to 0 (1 / highest numerical rank).
A song’s uniqueness rating is simply the average of each word’s uniqueness rating.
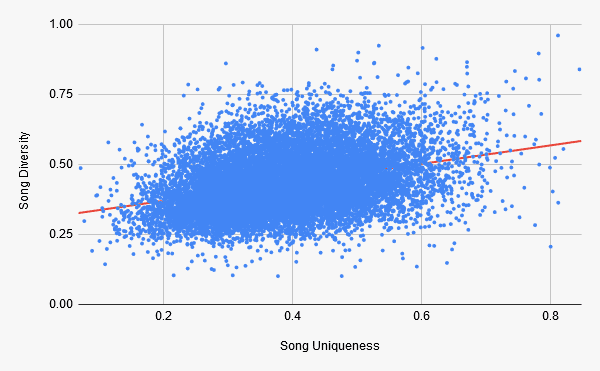
Above is a scatter plot of the uniqueness versus the diversity where each dot represents a song. The red line is the trend line of the data. The upward slope of the trend line also indicates that more unique songs are likely to be more diverse. This is somewhat intuitive because less repetitive songs must use more distinct words, which generally requires more specificity.
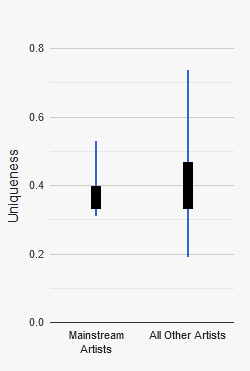
The candlestick graph above shows the overall uniqueness range (in blue) and the most common range (in black) for the 50 most popular mainstream artists and all other artists, respectively. Mainstream artists are less unique than all other artists. However, the difference is not as drastic as the difference between the diversity of mainstream artists and all other artists. The average uniqueness for all songs in the dataset is 0.39, but only 9 out of the top 50 mainstream artists have a uniqueness rating higher than average. It is worth noting that Eric Church is the most unique and the most diverse mainstream artist.
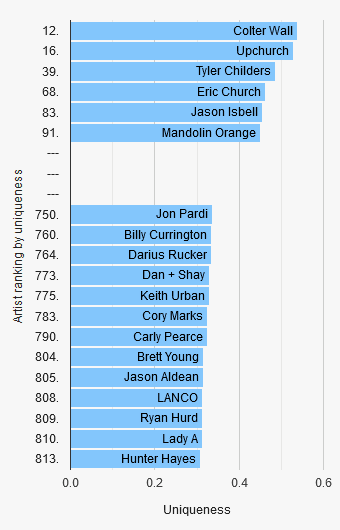
Above is a list of the top 100 and bottom 100 artists ranked by uniqueness. Only artists in the top 100 most popular are displayed. Overall, 6 of the 100 most popular artists are among the most unique, whereas 13 of the 100 most popular artists are among the least unique. I’d be remiss if I didn’t talk about Colter Wall for a second. He is the 12th most unique and the 32nd most diverse artist out of 836. There is no other artist in the entire dataset that comes anywhere close to ranking so highly in both categories.
Finally, it is worth noting that there has been no statistically significant change in uniqueness over the past decade.
Women in Country
It is well-known that there are woefully few women in country music, and the data I have collected bolsters that argument. In this dataset, 27% of all artists are female, and only 16% of the top 100 most popular artists are female.
(For this dataset, I decided to classify any group with a female lead singer as female.)

But how do the women stack up versus the men statistically? Well, basically the same. They average essentially the same as men in terms of uniqueness and diversity. However, on average, women are about 0.7% less stereotypical than men. This is because they are slightly less stereotypical in the alcohol, trucks, god, and lifestyle sub-categories.
Interestingly, they are almost the same in terms of stereotypicalness in the clothing and body sub-categories.
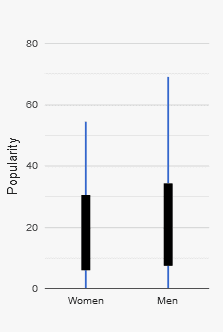
However, the main difference between men and women is popularity. This difference can be seen in the candlestick graph above. On average, men are almost 6 points more popular than women. While 6 points may not seem like much, that is the same popularity difference between Chris Stapleton and HARDY or Florida Georgia Line and Jason Isbell. No disrespect to HARDY or Jason Isbell, but those are fairly large differences.
Summary
The data shows that you cannot extrapolate the characteristics of mainstream country music to the entire country music genre. They are overly stereotypical and lacking in uniqueness, and especially diversity. At the end of the day, there are only so many different ways to cleverly sing about beer and trucks. To the casual and non-listeners of country music, this lack of uniqueness combined with increased repetition can make the genre feel shallow and monotonous.
It is a common trope that all country songs are about a dude in his truck drinking beer and trying to kiss the girl in blue jeans sitting shotgun. While it is an extreme exaggeration, it exists because of all of the characteristics of mainstream lyrics stated above. Are the lyrics the end all be all of what makes a good song? Absolutely not. Stereotypicalness does not automatically mean that a song is bad. However, subpar lyrics are boring and a burden to the song’s overall quality. Whether it is the instrumentation, melody, vocal performance… some other aspect of the song must compensate for the dead weight.
Sprinkled among the most popular artists are a few artists that go against the grain; they break the trends of mainstream country. There is a commonality between the ranking of the most diverse and most unique artists. They both include names such as Tyler Childers, Colter Wall, Sturgill Simpson, Jason Isbell, and Mandolin Orange. This is where it all comes back to the definition of popularity. Spotify’s popularity rating is not pre-determined by some CEO or record label. It is decided by the people. The popularity of the artists like Tyler Childers and Colter Wall proves that it is possible to be successful in the world of country music without following the formula of mainstream country. In an age where people have increasing power to chose what they listen to, they are evermore turning the metaphorical dial to more unique and diverse artists.
If you find yourself asking more questions about the data I presented here or would like to perform your own analysis using the interactive model, all the data and more is available at countrylyricanalysis.com.
Some of the website’s other features include ranking songs and sub-genres by popularity, stereotypicalness, diversity, and uniqueness, and searching for any artist or song. Most songs on the website include a 30-second preview. You can also view a song/artist/sub-genres specific statistics and rank and graph the most frequently used words in country music.


